- ZSell Newsletter
- Posts
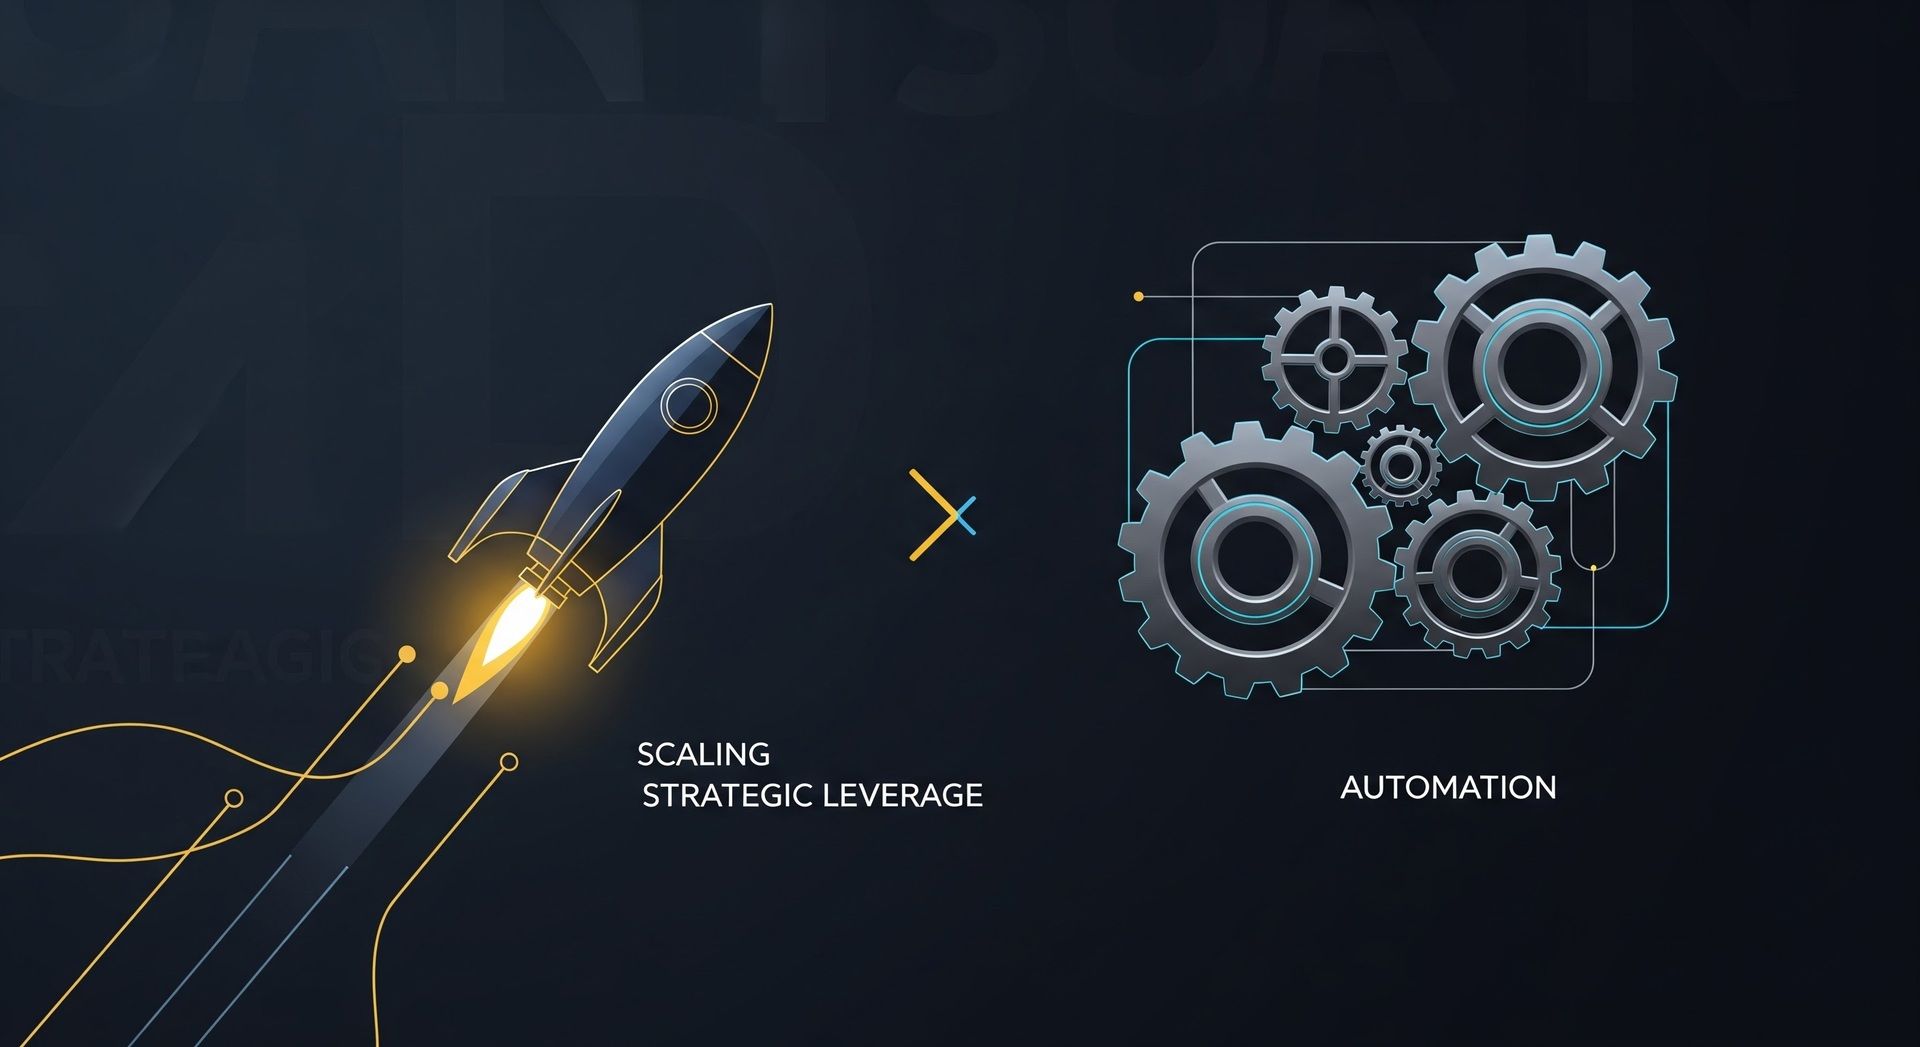
- 🚀 Scaling Through Automation: The Strategic Operator's Playbook
🚀 Scaling Through Automation: The Strategic Operator's Playbook
How to Separate Strategic Multipliers from Complexity Traps
Werner Heigl
November 26, 2025 • Reading Time: 10 minutes
Most e-commerce operators approach automation the way they approach product launches: they see a gap, buy a tool, and wonder why their business didn't transform overnight.
Here's what McKinsey data shows: 70% of digital transformation initiatives fail to meet their objectives. For AI-powered automation specifically, the failure rate climbs to 85%.
Not because the tools don't work - they usually do exactly what they promise - but because operators automate the wrong things.
The problem isn't technical. It's analytical. And after spending two decades applying signal processing to complex systems, I can tell you exactly where operators go wrong: they automate noise instead of signal.
Let me show you how to identify automation that actually creates leverage.
⚠️ The Automation Paradox: When Efficiency Creates Complexity
Not all filtering improves data quality. Sometimes, aggressive noise reduction removes the very patterns we're trying to detect. The same principle applies to business automation.
Consider the typical automation trajectory:
📈 Phase 1: The Quick Win
Operator identifies repetitive task → Implements automation tool → Saves 5 hours/week → Declares victory
⚠️ Phase 2: The Complexity Cascade
Automated system requires monitoring → Edge cases demand manual intervention → Integration breaks with platform updates → Net time savings: 2 hours/week (not 5)
🔄 Phase 3: The Maintenance Trap
System requires constant adjustment → Staff needs training on new tool → Original time savings evaporates → Operator now manages automation complexity instead of original task
The pattern is predictable: most automation trades one form of complexity for another without creating strategic leverage.
💡 Critical Question
Not "Can I automate this?" but "Does automating this multiply my capacity or just shift where I spend time?"
🎯 Two Types Of Automation
In signal analysis, we distinguish between operations that enhance signal and operations that simply transform data. The same framework applies to automation decisions.
🚀 Type 1: Strategic Multipliers (High Leverage)
These automations create compound returns - the benefits multiply as your business scales:
Automation Type | Scale Advantage | Human Role | Leverage Pattern |
|---|---|---|---|
🔍 Pattern Recognition Systems | 1 analysis → 10,000 products evaluated | Strategic decision on findings | Exponential (more data = better patterns) |
💰 Dynamic Pricing Optimization | Manual repricing impossible beyond 50 SKUs | Set strategic pricing parameters | Linear to revenue growth |
📦 Inventory Forecasting Models | Complexity increases with SKU count | Review outliers and adjust | Prevents stockouts + overstock |
⭐ Supplier Performance Scoring | Manual tracking fails beyond 3-5 suppliers | Relationship management strategy | Better negotiations, risk mitigation |
👥 Customer Segmentation Engines | Impossible to manually segment 10,000+ customers | Design retention strategies | Increases LTV per cohort |
⚙️ Type 2: Complexity Trades (Low Leverage)
These automations save time but create new overhead:
Automation Type | Benefit | Cost | Net Result | Justification Threshold |
|---|---|---|---|---|
📋 Order Processing Automation | Reduces manual entry time | Requires exception handling system | Time saver, not force multiplier | >200 orders/day |
📧 Email Response Templates | Faster customer service | Template maintenance, edge cases | Marginal efficiency gain | High standardized query volume |
📱 Social Media Scheduling | Content published consistently | Still requires content creation | Scheduling efficiency only | Multi-platform presence |
📊 Automated Reporting Dashboards | Data visualization | Dashboard maintenance, manual interpretation | Presentation efficiency | Daily metrics-driven decisions |
💡 Key Distinction
Strategic Multipliers create new capabilities you couldn't achieve manually at any scale. Complexity Trades make existing tasks faster but don't fundamentally change what's possible.
🔬 Signal Analysis: Identifying High-Leverage Opportunities
Signal filtering techniques help separate meaningful patterns from background noise. The same analytical approach reveals which automation opportunities deserve investment.
🎲 The Four-Question Filter
Question 1: Does this automation make decisions or execute decisions?
✅ Decision-making automation = Strategic Multiplier
Identifies opportunities (product research)
Predicts outcomes (demand forecasting)
Optimizes parameters (pricing, inventory)
⚙️ Execution automation = Complexity Trade
Processes orders
Sends emails
Updates spreadsheets
💡 Why it matters: Decision-making automation scales your strategic capacity. Execution automation just speeds up tasks.
Question 2: Does performance improve with more data?
📈 Improves with data = Strategic Multiplier
Machine learning models get better
Pattern recognition becomes more accurate
Predictions improve over time
📊 Static performance = Complexity Trade
Does the same thing regardless of data volume
No learning or improvement
Fixed benefit
💡 Why it matters: Strategic Multipliers create compounding returns. The longer you use them, the more valuable they become.
Question 3: What happens if this automation fails?
🚨 High-impact failure = Strategic Multiplier
Missed market opportunities
Significant revenue loss
Competitive disadvantage
⚠️ Low-impact failure = Complexity Trade
Manual workaround available
Temporary inconvenience
Minimal strategic impact
💡 Why it matters: If automation failure doesn't significantly hurt your business, it probably wasn't providing significant leverage.
Question 4: Does this automation free time for strategic work or just different operational work?
🎯 Frees strategic capacity = Strategic Multiplier
Allows market analysis
Enables expansion planning
Creates time for relationship building
🔄 Shifts operational tasks = Complexity Trade
Move from Task A to Task B
Different work, same operational level
No strategic capacity gained
💡 Why it matters: The goal isn't to be busy differently. The goal is to operate at a higher strategic level.📊 Static performance = Complexity Trade
💰 Revenue-Scaled Implementation: When to Automate What
The right automation strategy depends on your operational scale. Implementing advanced systems too early wastes capital. Delaying too long leaves money on the table.
💵 $50K-$150K Monthly Revenue: Foundation Layer
Priority | Automation Type | Investment | ROI Threshold | Human Role |
|---|---|---|---|---|
1️⃣ | Inventory Management - Basic forecasting with seasonality | $100-300/month | Prevents one major stockout or overstock per quarter | Weekly review, manual adjustments for promotions |
2️⃣ | Repricing Automation - Rule-based repricing with competitor tracking | $150-400/month | 2-3% margin improvement across catalog | Set pricing strategy parameters, review outliers |
3️⃣ | Basic Customer Segmentation - Identify repeat vs. one-time buyers | $50-150/month | 10% improvement in repeat purchase rate | Design retention strategies per segment |
❌ Avoid at this stage:
Advanced ML forecasting (overkill, insufficient data) • Multi-channel inventory sync (complexity exceeds benefit) • Automated ad optimization (manual provides better learning)
💎 $150K-$500K Monthly Revenue: Strategic Intelligence Layer
Priority | Automation Type | Investment | ROI Threshold | Human Role |
|---|---|---|---|---|
1️⃣ | Market Opportunity Analysis - Pattern recognition in market data | $500-1,500/month or annual licensing | One successful product launch per quarter | Evaluate opportunities, make go/no-go decisions |
2️⃣ | Advanced Inventory Optimization - ML-based forecasting with demand sensing | $300-800/month | 5-10% reduction in working capital tied up | Strategic inventory allocation decisions |
3️⃣ | Supplier Performance Analytics - Automated scoring across quality/delivery/cost | $200-500/month or build internal | 3-5% better negotiated terms | Relationship strategy, contract negotiations |
❌ Avoid at this stage:
Full warehouse automation (capital intensive, premature) • Custom AI development (buy beats build at this scale) • Enterprise integration platforms (complexity exceeds needs)
🚀 $500K-$1M+ Monthly Revenue: Competitive Advantage Layer
Priority | Automation Type | Investment | ROI Threshold | Human Role |
|---|---|---|---|---|
1️⃣ | Predictive Analytics Suite - Custom ML models or advanced SaaS platforms | $1,500-5,000/month | 10%+ improvement in forecast accuracy | Strategic planning based on predictions |
2️⃣ | Dynamic Multi-Channel Optimization - Unified optimization across channels | $1,000-3,000/month | 5-7% efficiency improvement across channels | Set strategic priorities per channel |
3️⃣ | Customer Lifetime Value Modeling - Behavioral prediction models | $800-2,000/month | 15%+ improvement in acquisition ROI | Strategic decisions on customer acquisition spend |
✅ Now justified:
Warehouse automation systems (volume supports ROI) • Custom integration development (complexity now necessary) • Dedicated automation engineering resources
🎯 The Pattern Recognition Advantage
Signal processing teaches a useful principle: the most valuable information isn't in the data everyone sees - it’s in the patterns most people miss.
This explains a common automation mistake: operators automate what's obvious and tactical while overlooking what's strategic.
Why? Because tactical tasks are obvious. Strategic opportunities require pattern recognition.
Consider product research. Most operators:
Browse Amazon manually
Check a few categories they know
Evaluate 20-30 products
Make intuitive decisions
Launch and hope
This approach doesn't scale. You're limited by:
Time to manually evaluate products
Bias toward familiar categories
Inability to spot emerging patterns
Reactive rather than predictive analysis
Strategic automation transforms this:
Analyze thousands of products simultaneously
Identify patterns across categories
Spot opportunities before competitors
Predict demand trajectories
Quantify risk vs. opportunity
The difference isn't speed. It's seeing patterns that don't exist in small samples.
Market data is noisy - full of temporary fluctuations, seasonal anomalies, and false signals. The question isn't "What's selling now?", the question is "What patterns predict sustained opportunity?"
📋 Implementation: The Strategic Automation Roadmap
Based on revenue-scaled priorities, here's your practical roadmap:
🔍 Month 1: Audit Current State
Map time spent on operational vs. strategic tasks
Identify bottlenecks preventing scale
Classify potential automations: Strategic Multipliers vs. Complexity Trades
Prioritize based on leverage potential
🚀 Month 2: Foundation Layer
Implement inventory management automation
Set up repricing automation with strategic parameters
Deploy basic customer segmentation
Document time savings and strategic capacity gained
📊 Month 3: Measure and Adjust
Compare operational time allocation to Month 1
Measure: Did strategic capacity actually increase?
Identify next highest-leverage opportunity
Refine existing automation based on learnings
🎯 Quarter 2: Intelligence Layer (if $150K+ monthly)
Add market opportunity analysis capability
Upgrade to ML-based inventory forecasting
Implement supplier performance tracking
Focus automation on decision-making, not just execution
🔧 Quarter 3: Optimization
Review ROI on all automation investments
Eliminate low-leverage tools (honest assessment)
Double down on Strategic Multipliers
Consider custom development for unique competitive advantages
🏆 Quarter 4: Competitive Advantage (if $500K+ monthly)
Deploy predictive analytics suite
Implement multi-channel optimization
Add customer LTV modeling
Strategic automation now provides sustainable competitive moat
💼 The Tax Timing Advantage
One final consideration for Q4 2024 and Q1 2025: automation investments may qualify for immediate expensing under current tax provisions.
Rather than capitalizing software and equipment costs, you can potentially deduct the full amount in the year of purchase. For a $10K annual license on market intelligence software, that could mean $10K in immediate deductions rather than amortized over 3-5 years.
This creates a timing advantage: automation investments made before certain legislative windows close could provide both operational and tax benefits.
I'll explore the broader strategic implications of legislative sunset provisions and equipment expensing schedules in next week's analysis of H.R.1's 2030 cliff.
For now, the key insight: if you've identified high-leverage automation opportunities, Q4 implementation may maximize both operational and tax benefits.
✅ Bottom Line
Not all automation creates leverage. Most automation just trades one form of complexity for another.
Strategic automation does three things:
1️⃣ Makes decisions, not just executes tasks
2️⃣ Improves with data over time
3️⃣ Creates capabilities impossible to achieve manually
Focus your automation investments on Strategic Multipliers - pattern recognition, predictive analytics, dynamic optimization. These tools don't just save time. They let you see and act on opportunities competitors miss.
🎯 The Competitive Edge
The operators who scale aren't working harder. They're using automation to operate at a strategic level their competition can't reach.
That's the difference between efficiency and leverage.
Werner Heigl
ZSell Newsletter
Strategic Intelligence for E-Commerce Operators